
Infographics in School: Transforming Education with Visual Learning
The traditional classroom is evolving. Gone are the days when students sat passively, absorbing information from textbooks and blackboards. Today's educators are embracing visual learning tools that not only capture attention but also significantly improve comprehension and retention. At the forefront of this educational revolution? Infographics.
These powerful visual tools are transforming how teachers teach and how students learn, making complex concepts accessible, engaging, and memorable. Let's explore how infographics are reshaping education and why they've become an essential tool in modern classrooms.
The Science Behind Visual Learning in Education
Why Visual Learning Works
Research consistently shows that visual learning is one of the most effective educational approaches:
- 65% of people are visual learners - they process information better through images, charts, and graphics
- Visual information is processed 60,000 times faster than text-based information
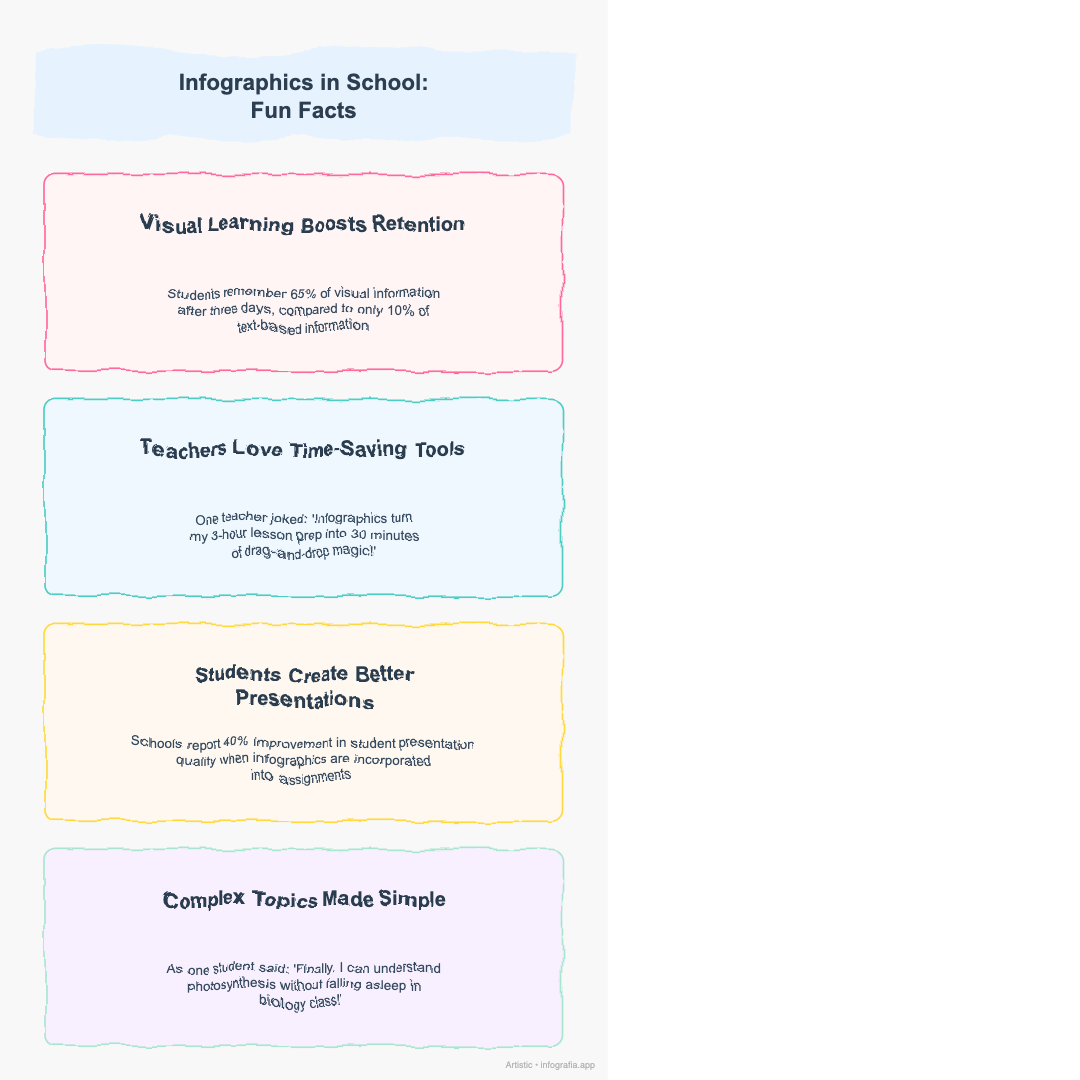
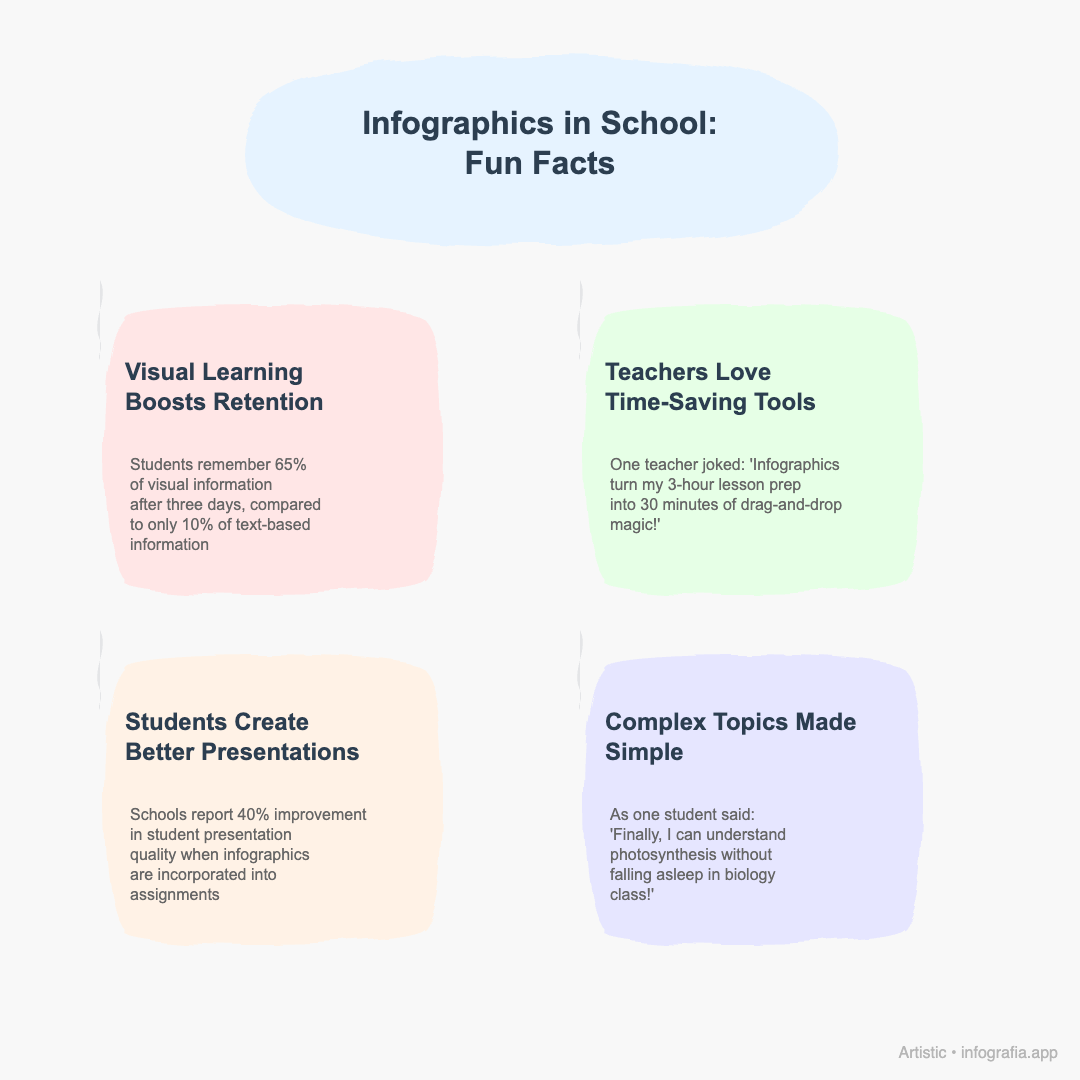
- Students retain 65% of visual information after three days, compared to only 10% of text-based information
- Visual aids improve learning by up to 400% according to educational research
The Cognitive Benefits
Visual learning engages multiple areas of the brain simultaneously:
- Visual cortex processes images and graphics
- Language centers interpret text and labels
- Memory systems store both visual and textual information
- Emotional centers respond to colors and design elements
This multi-sensory approach creates stronger neural pathways, leading to better understanding and longer retention.
The Perfect Format for Every Educational Need
Instagram Stories Format (9:16) - Mobile-First Learning
The vertical format is perfect for modern, mobile-first educational environments:
Ideal For:
- Student presentations on tablets and phones
- Social media sharing of educational content
- Digital portfolios and student showcases
- Parent communication through school apps
- Remote learning on mobile devices
Benefits:
- Full-screen impact on mobile devices
- Easy scrolling through multiple facts
- Social media ready for school accounts
- Parent-friendly format for home communication
Square Format (1:1) - Traditional Classroom Use
The square format works perfectly for traditional educational settings:
Ideal For:
- Classroom displays and bulletin boards
- Printed handouts and study materials
- Presentation slides and projectors
- Student portfolios and reports
- Educational websites and learning management systems
Benefits:
- Versatile sizing for multiple uses
- Print-friendly format
- Social media compatible for school accounts
- Professional appearance in academic settings
Subject-Specific Infographic Applications
Science Education
Biology:
- Cell structure diagrams
- Ecosystem relationships
- Evolution timelines
- Genetic inheritance patterns
Chemistry:
- Periodic table visualizations
- Chemical reaction processes
- Molecular structures
- Laboratory safety procedures
Physics:
- Force diagrams
- Energy transformation processes
- Wave properties
- Circuit diagrams
Mathematics
Elementary Math:
- Number line visualizations
- Fraction representations
- Geometric shapes and properties
- Problem-solving strategies
Advanced Math:
- Function graphs and transformations
- Statistical data representations
- Geometric proofs
- Calculus concepts
Social Studies
History:
- Timeline visualizations
- Cause-and-effect relationships
- Historical figure connections
- Cultural comparisons
Geography:
- Map-based information
- Climate data visualizations
- Population statistics
- Economic indicators
Civics:
- Government structure diagrams
- Voting process flows
- Constitutional amendments
- Rights and responsibilities
Language Arts
Literature:
- Character relationship maps
- Plot structure diagrams
- Theme analysis charts
- Literary device examples
Writing:
- Essay structure guides
- Grammar rule visualizations
- Writing process flows
- Citation format guides
Creating Educational Infographics: Best Practices
Design Principles for Educational Content
1. Clarity is King
- Use clear, readable fonts (minimum 12pt for print)
- Maintain high contrast between text and background
- Keep simple, uncluttered layouts
- Use consistent color schemes throughout
2. Age-Appropriate Design
- Elementary: Bright colors, large fonts, simple shapes
- Middle School: Balanced colors, medium fonts, moderate complexity
- High School: Professional colors, standard fonts, detailed information
- College: Sophisticated design, comprehensive data, academic tone
3. Accessibility Considerations
- Color-blind friendly palettes
- High contrast for visual impairments
- Large fonts for readability
- Simple language for comprehension
Content Guidelines
1. Focus on Key Concepts
- Limit to 3-5 main points per infographic
- Use bullet points for easy scanning
- Include supporting details without overwhelming
- Maintain logical flow of information
2. Use Visual Hierarchy
- Titles should be largest and most prominent
- Subheadings should be clearly distinguished
- Body text should be readable but not dominant
- Captions should provide additional context
3. Include Credible Sources
- Cite reliable educational resources
- Use current data and statistics
- Reference peer-reviewed research when possible
- Include source citations for credibility
Technology Integration in Modern Classrooms
Digital Learning Platforms
Learning Management Systems (LMS):
- Canvas, Blackboard, Google Classroom integration
- Embedded infographics in course content
- Interactive elements for student engagement
- Progress tracking through visual assessments
Educational Apps:
- Student-created infographics for projects
- Collaborative design tools for group work
- Template libraries for quick creation
- Sharing capabilities for peer learning
Assessment and Evaluation
Visual Assessment Tools:
- Infographic rubrics for project evaluation
- Peer review systems for student work
- Portfolio development with visual elements
- Presentation skills assessment through visual content
Benefits of Visual Learning in Education
Improved Comprehension and Retention
Visual learning tools like infographics help students:
- Process information faster through visual processing
- Retain knowledge longer with dual coding (visual + text)
- Understand complex relationships through diagrams and charts
- Engage with content more actively than passive reading
Enhanced Student Engagement
When students can see information presented visually:
- Attention spans increase due to visual stimulation
- Learning becomes more interactive and participatory
- Abstract concepts become concrete through visual representation
- Multiple learning styles are accommodated simultaneously
The Future of Visual Learning in Education
Emerging Trends
Interactive Infographics:
- Clickable elements for deeper exploration
- Animated sequences for process explanation
- Personalized content based on learning pace
- Real-time data integration
AI-Powered Creation:
- Automated design suggestions
- Content optimization for different learning styles
- Accessibility features built-in
- Multilingual support for diverse classrooms
Virtual and Augmented Reality:
- 3D infographic experiences
- Immersive learning environments
- Interactive data manipulation
- Collaborative virtual spaces
Preparing Students for the Future
21st Century Skills Development:
- Visual literacy for information processing
- Digital design skills for communication
- Data interpretation abilities
- Creative problem-solving through visual thinking
Getting Started: A Teacher's Guide
Step 1: Choose Your Topic
- Identify challenging concepts that need visual support
- Consider student interests and engagement factors
- Select appropriate complexity for grade level
- Plan learning objectives and assessment criteria
Step 2: Design Your Infographic
- Use our template library for professional results
- Customize colors and fonts for your classroom
- Include relevant data and statistics
- Test readability with students
Step 3: Integrate into Lessons
- Introduce concepts with visual support
- Encourage student interaction with content
- Use for review and reinforcement
- Assess understanding through visual projects
Step 4: Evaluate and Improve
- Gather student feedback on effectiveness
- Track learning outcomes and improvements
- Refine design based on results
- Share successes with colleagues
Tools and Resources for Educators
Free Resources
- Template libraries with educational themes
- Design tutorials for beginners
- Content guidelines for different subjects
- Accessibility checklists for inclusive design
Professional Development
- Workshops on visual learning strategies
- Online courses on infographic creation
- Peer collaboration networks
- Best practice sharing communities
Conclusion: The Visual Learning Revolution
Infographics are more than just pretty pictures – they're powerful educational tools that transform how students learn and how teachers teach. By making complex information accessible, engaging, and memorable, infographics are helping educators create more effective learning experiences for students of all ages.
The evidence is clear: when students can see information presented visually, they understand better, remember longer, and engage more deeply with the content. Teachers save time, students learn more effectively, and everyone benefits from the improved educational experience.
Ready to transform your classroom with visual learning? Start creating educational infographics that make learning fun, engaging, and effective.
Don't let your lessons get lost in translation. Create educational infographics that make learning stick and watch your students' understanding soar to new heights.